CPM Model Results
1 Cell
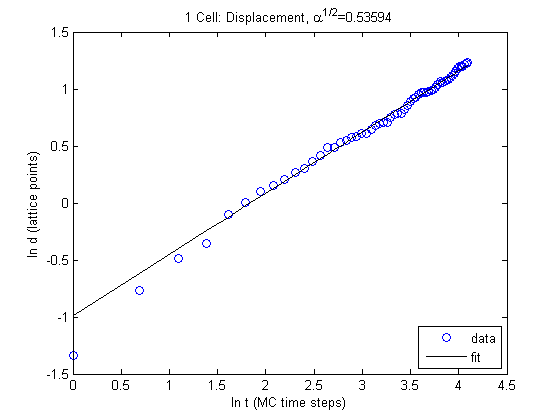
Resting Area of 4 Pixels
The simulation ran for 100 different instances each for a maximum of 60 Monte Carlo (MC) time steps.
From the simulations we were able to get statistics on the mean square displacement (MSD) and the displacement of the cell.
\[d^2 \equiv \text{ Mean Square Displacement } \\ d \equiv \text{ Displacement }\]For 2-dimensional diffusion the MSD should obey the following relationship
\[d^2 = 4Dt^\alpha \ .\]Where \(D\) is the diffusion coefficient and \(\alpha\) should be equal to 1.
Results
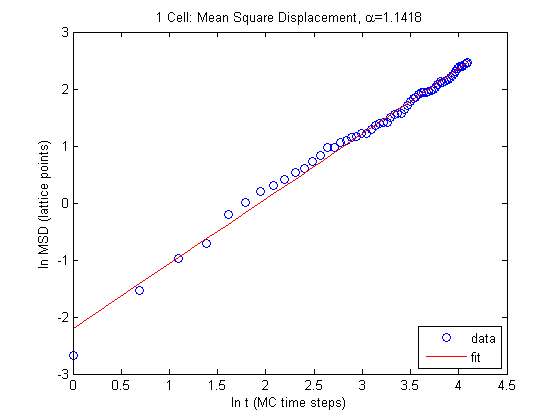
So fitting our whole data we get the following values for \(\alpha\) and \(D\) (in simulation units).
\[\alpha = 1.1418 \\ D = 0.0267\]This is in relatively good agreement with expectations and with the result from the Szabo paper which states that displacement grows with time as
\[d \sim \sqrt{t} \ .\]We can get closer agreement if we ignore the outlying, first three data points from our fit.
Which yields…
\[\alpha = 1.0719 \\ D = 0.0274\]Resting Area of 50 Pixels
Results
Here is a movie of a typical cell.
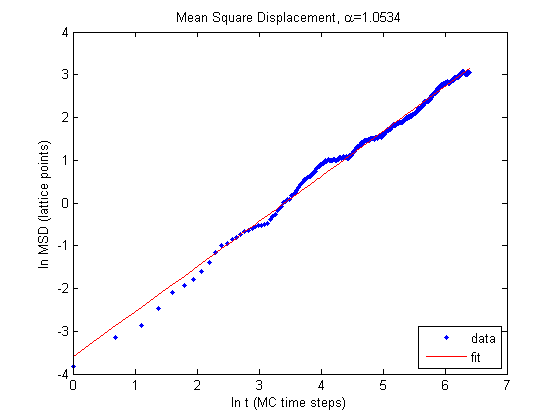
The results look good! The single cell with a relaxed area of 50 pixels does exhibit normal diffusion. We can also compare our results to that of the Szabo et al paper to see how our simulation compares. To do this one MC time step becomes one minute and the distance between one lattice site becomes 5\(\mu\text{m}\).
We can translate our data into these units and plot the mean displacement.
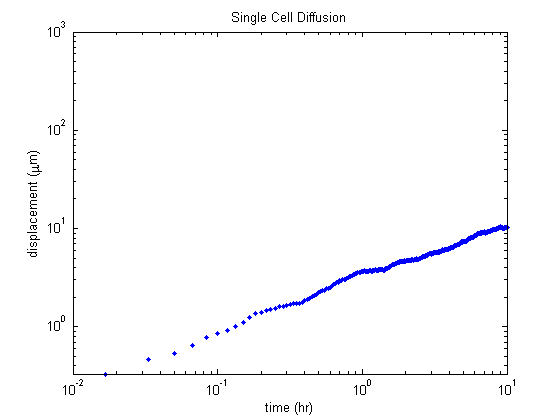
This appears to be in good agreement with the results from the paper. At 10 hours the mean displacement is around \(10 \mu\text{m}\) which is inline with the results from the paper.
I attempted to overlay this plot onto that from the paper in order to see how well the data matched up.
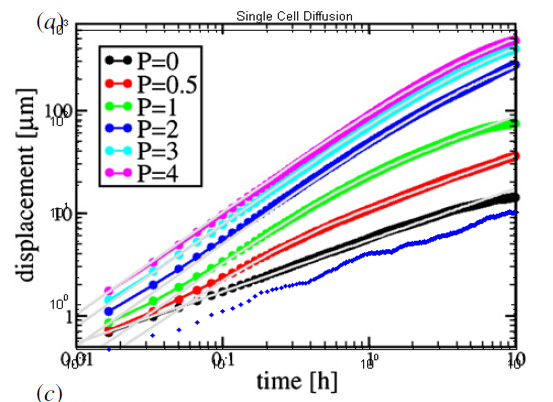
As you can see the data from the simulations (bottom blue) is very similar to the black curve from the paper. The slopes seem to be in agreement but there is an off set which corresponds to a difference in diffusion coefficients. I believe that some of the off set is due my plot not exactly lining up with how the plot from the paper scales but this still that does not explain away the whole off set.
Multiple Cells
In the case of multiple cells the relative values of the energy terms associated with free-cell and cell-cell boundaries are important.
\[\alpha \equiv \text{cell-cell boundary energy} \\ \beta \equiv \text{free-cell boundary}\]Please be aware of the difference between this use of \(\alpha\) and that in the context of diffusion.
In the Szabo paper \(\alpha \in \{1,2,3,4\}\) and \(\beta = 1\). However, in the paper’s simulations of cell monolayers there are no free-cell boundaries so the \(\beta\) parameter becomes irrelevant. The paper reports that increasing \(\alpha\) causes movement of cells within the monolayer to decrease. This makes sense since increasing \(\alpha\) causes the energy due to changing the cell boundaries to increase making movement less probable.
I believe that mimicking the values of \(\alpha\) and \(\beta\) from the paper is not productive since we do want to consider a group of cells with free-cell boundaries. If \(\alpha > \beta\) then cell-cell boundaries are not favorable which will cause the group of cells to break apart. Therefore, we should restrict the parameters to \(\alpha < \beta\) in order to maintain cell-cell contact.
Here is a video for the case of \(\alpha = 2\) and \(\beta=1\).
So I have chosen the following values for the parameters.
\[\alpha = 0.5 \\ \beta = 1.0\]This satisfies the criteria for favorable cell-cell contact, and also keeps the same value of \(\beta\) from single cell simulations.
Below is a a video for the case of \(\alpha = 0.5\) and \(\beta = 1\).
Results - Updated ( 6/3 )
Here are updated results with tracking of the whole group of cells center of mass properly implemented.
As before, \(\alpha = 0.5\) and \(\beta = 1\) and a relaxed area of 4 pixels.
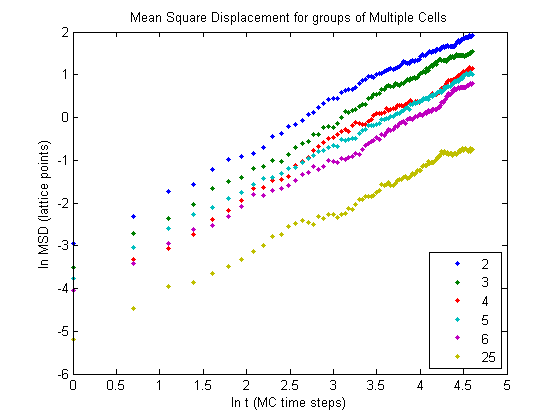
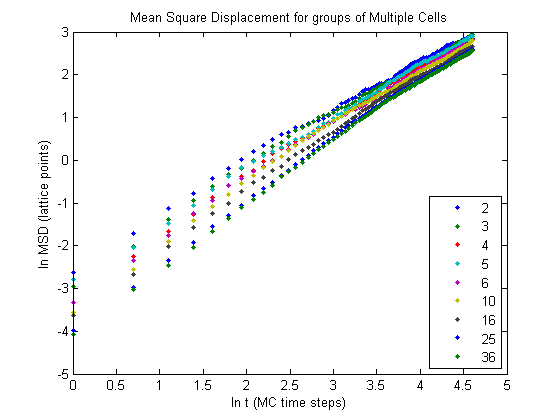
The results shown will be for the case of \(\alpha = 0.5\) and \(\beta = 1\) and a relaxed area of 4 pixels. Below are the results for the MSD for groups of various number of cells.
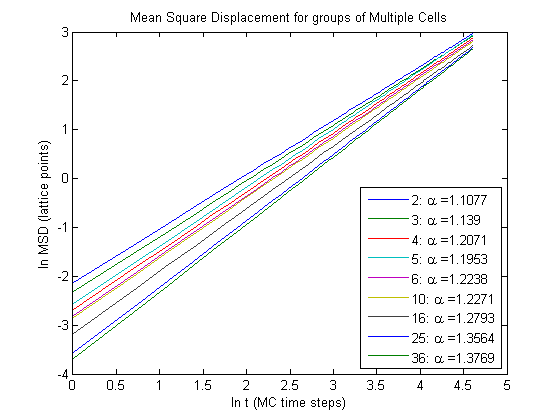
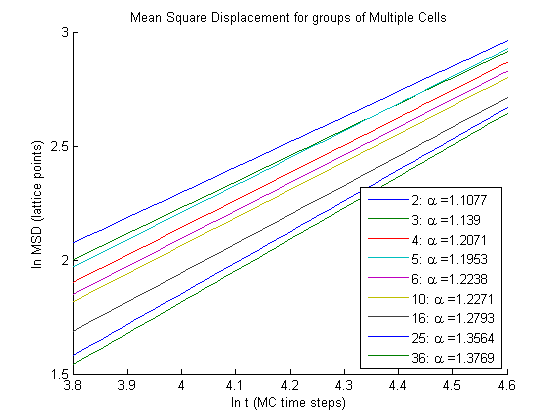
We can get a better idea for what is going on if we plot the fits for each respective data set.
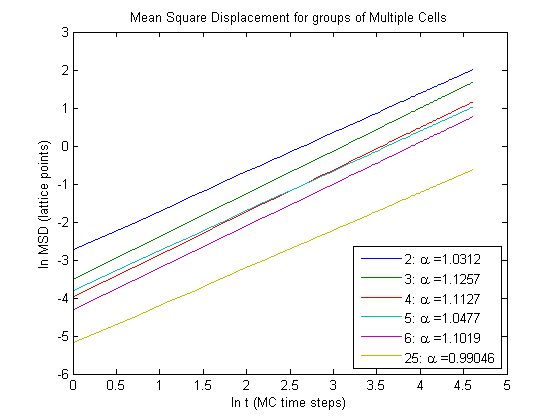
Notice that the groups move slower as the number of cells in a group increases. The relationship between MSD and time remains linear as the number of cells varies.
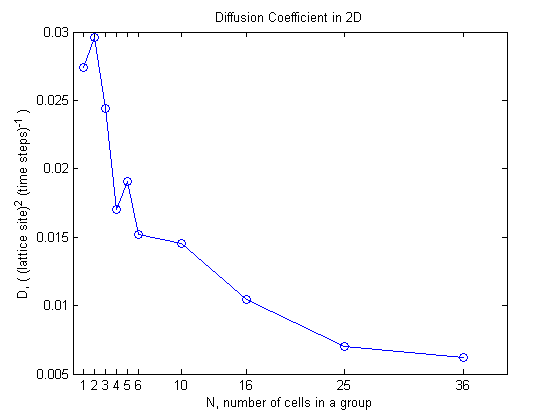
Lets see what happens to the diffusion coefficient as the group size changes.
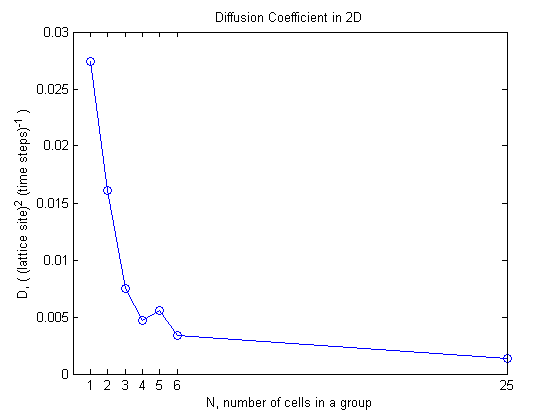
The overall behavior is that as the group size increases the diffusion coefficient decreases and it seems to be approaching some lower bound.
Old Results ( 5/ 22 )
We can get a better for what is going on if we plot the fits for each respective data set.
As you can see as the number of cells in a group increases so does \(\alpha\). So as the number of cells increases diffusion of the group becomes more anomalous.
Lets see what happens to the diffusion coefficient as the group size changes.
The overall behavior is that as the group size increases the diffusion coefficient decreases and it seems to be approaching some lower bound. So even though \(\alpha\) increases this does not lead to faster diffusion for larger groups since the diffusion coefficient decreases.
Notes on Calculating Diffusion Coefficient and \(\alpha\)
Assume that the mean square displacement (MSD) follows the relationship
\[d^2 = 4Dt^\alpha \ .\] \[\begin{align*} \ln d^2 &= \ln \left( 4Dt^\alpha \right) \\ &= \ln 4D + \alpha \ln t \end{align*}\]The simulations give us data for \(d^2\) as a function of the number of time steps taken \(t\). Taking the logarithm of the data obtained we should be able to fit it to a linear function.
\[\begin{align*} \ln d^2 &\to y \\ \ln t &\to x \\ \end{align*}\] \[y = f(x) = p_1 x + p_0\] \[\Rightarrow \begin{align*} p_1 &= \alpha \\ p_0 &= \ln 4D \end{align*} \\ D = \frac{1}{4} \ e^{p_0}\]Julien Varennes